Solana and Avalanche appear to be at risk of a steep correction. These tokens need to reclaim vital support levels quickly to avoid further losses.
Trouble Ahead
Solana and Avalanche experienced a 2% correction over the past few hours, which correlates with Ethereum’s successful transition to Proof-of-Stake.
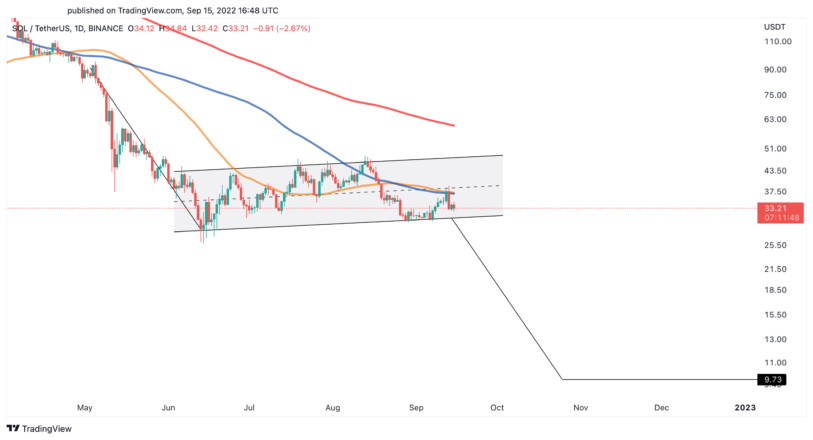
Solana appears to form a bear flag on its daily chart as the hype around the Merge fades. This technical formation anticipates that breaking the $30 support level can trigger a 70% correction. If validated, a spike in selling pressure could push SOL below $10.
Despite the pessimistic outlook, not everything is lost for Solana. The Layer 1 blockchain’s token needs to reclaim its 50-day moving average as support to have a chance of rebounding. Moving past this resistance level could help SOL rise to $48 or even to the 200-day moving average at $60.

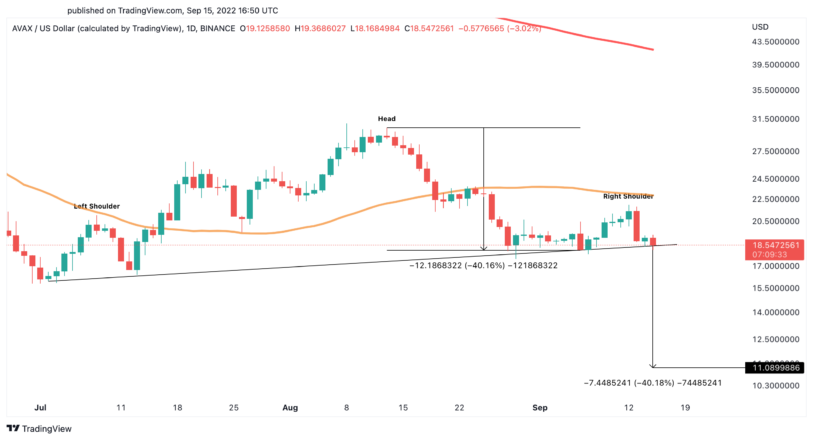
Avalanche also appears to be developing a bearish technical formation on its daily chart. AVAX could be forming the right shoulder of a head-and-shoulders pattern. A sustained daily close below $17 can increase the odds of a steep correction.
If this happens and Avalanche dips below the pattern’s neckline, a 40% correction to $11 becomes a strong possibility. For AVAX to advance higher, it must slice through the 50-day moving average to invalidate this bearish thesis. Doing so could induce a surge toward its 200-day moving average at $42.

Given Solana and Avalanche’s bearish scenarios, it is imperative to wait for a decisive close below support or above resistance before trying to time their next major price movements.
Disclosure: At the time of writing, the author of this piece owned BTC and ETH. The information contained in this piece is for educational purposes only and is not investment advice.
For more key market trends, subscribe to our YouTube channel and get weekly updates from our lead bitcoin analyst Nathan Batchelor
Source : cryptobriefing


